
Using Data and Design to Drive Business
Specializing in custom front-end designs and curated user experiences, interwoven with meaningful data and built with the latest web technologies
Stephen Marshall
Full Stack Software Engineer, Data Visualization & Analytics
Hello! My name is Stephen, and I currently work full-time in the Aerospace industry as a full stack/front end engineer. I was born in France, grew up in Washington DC, and moved to Colorado in 2007. I've
been building websites since I moved from Boulder to Denver in 2011, and started Union in Design around 2012 to provide web design and development services to friends, local businesses and non-profits.
After working in sales for nearly a decade, I've had exposure to number of other industries including travel, real-estate, education, and fitness. I've been working in software full-time since 2018 as
Developer and Data Analyst, with certificates from University of Denver in both the Full Stack Web Developer and Data Visualization & Analytics programs.
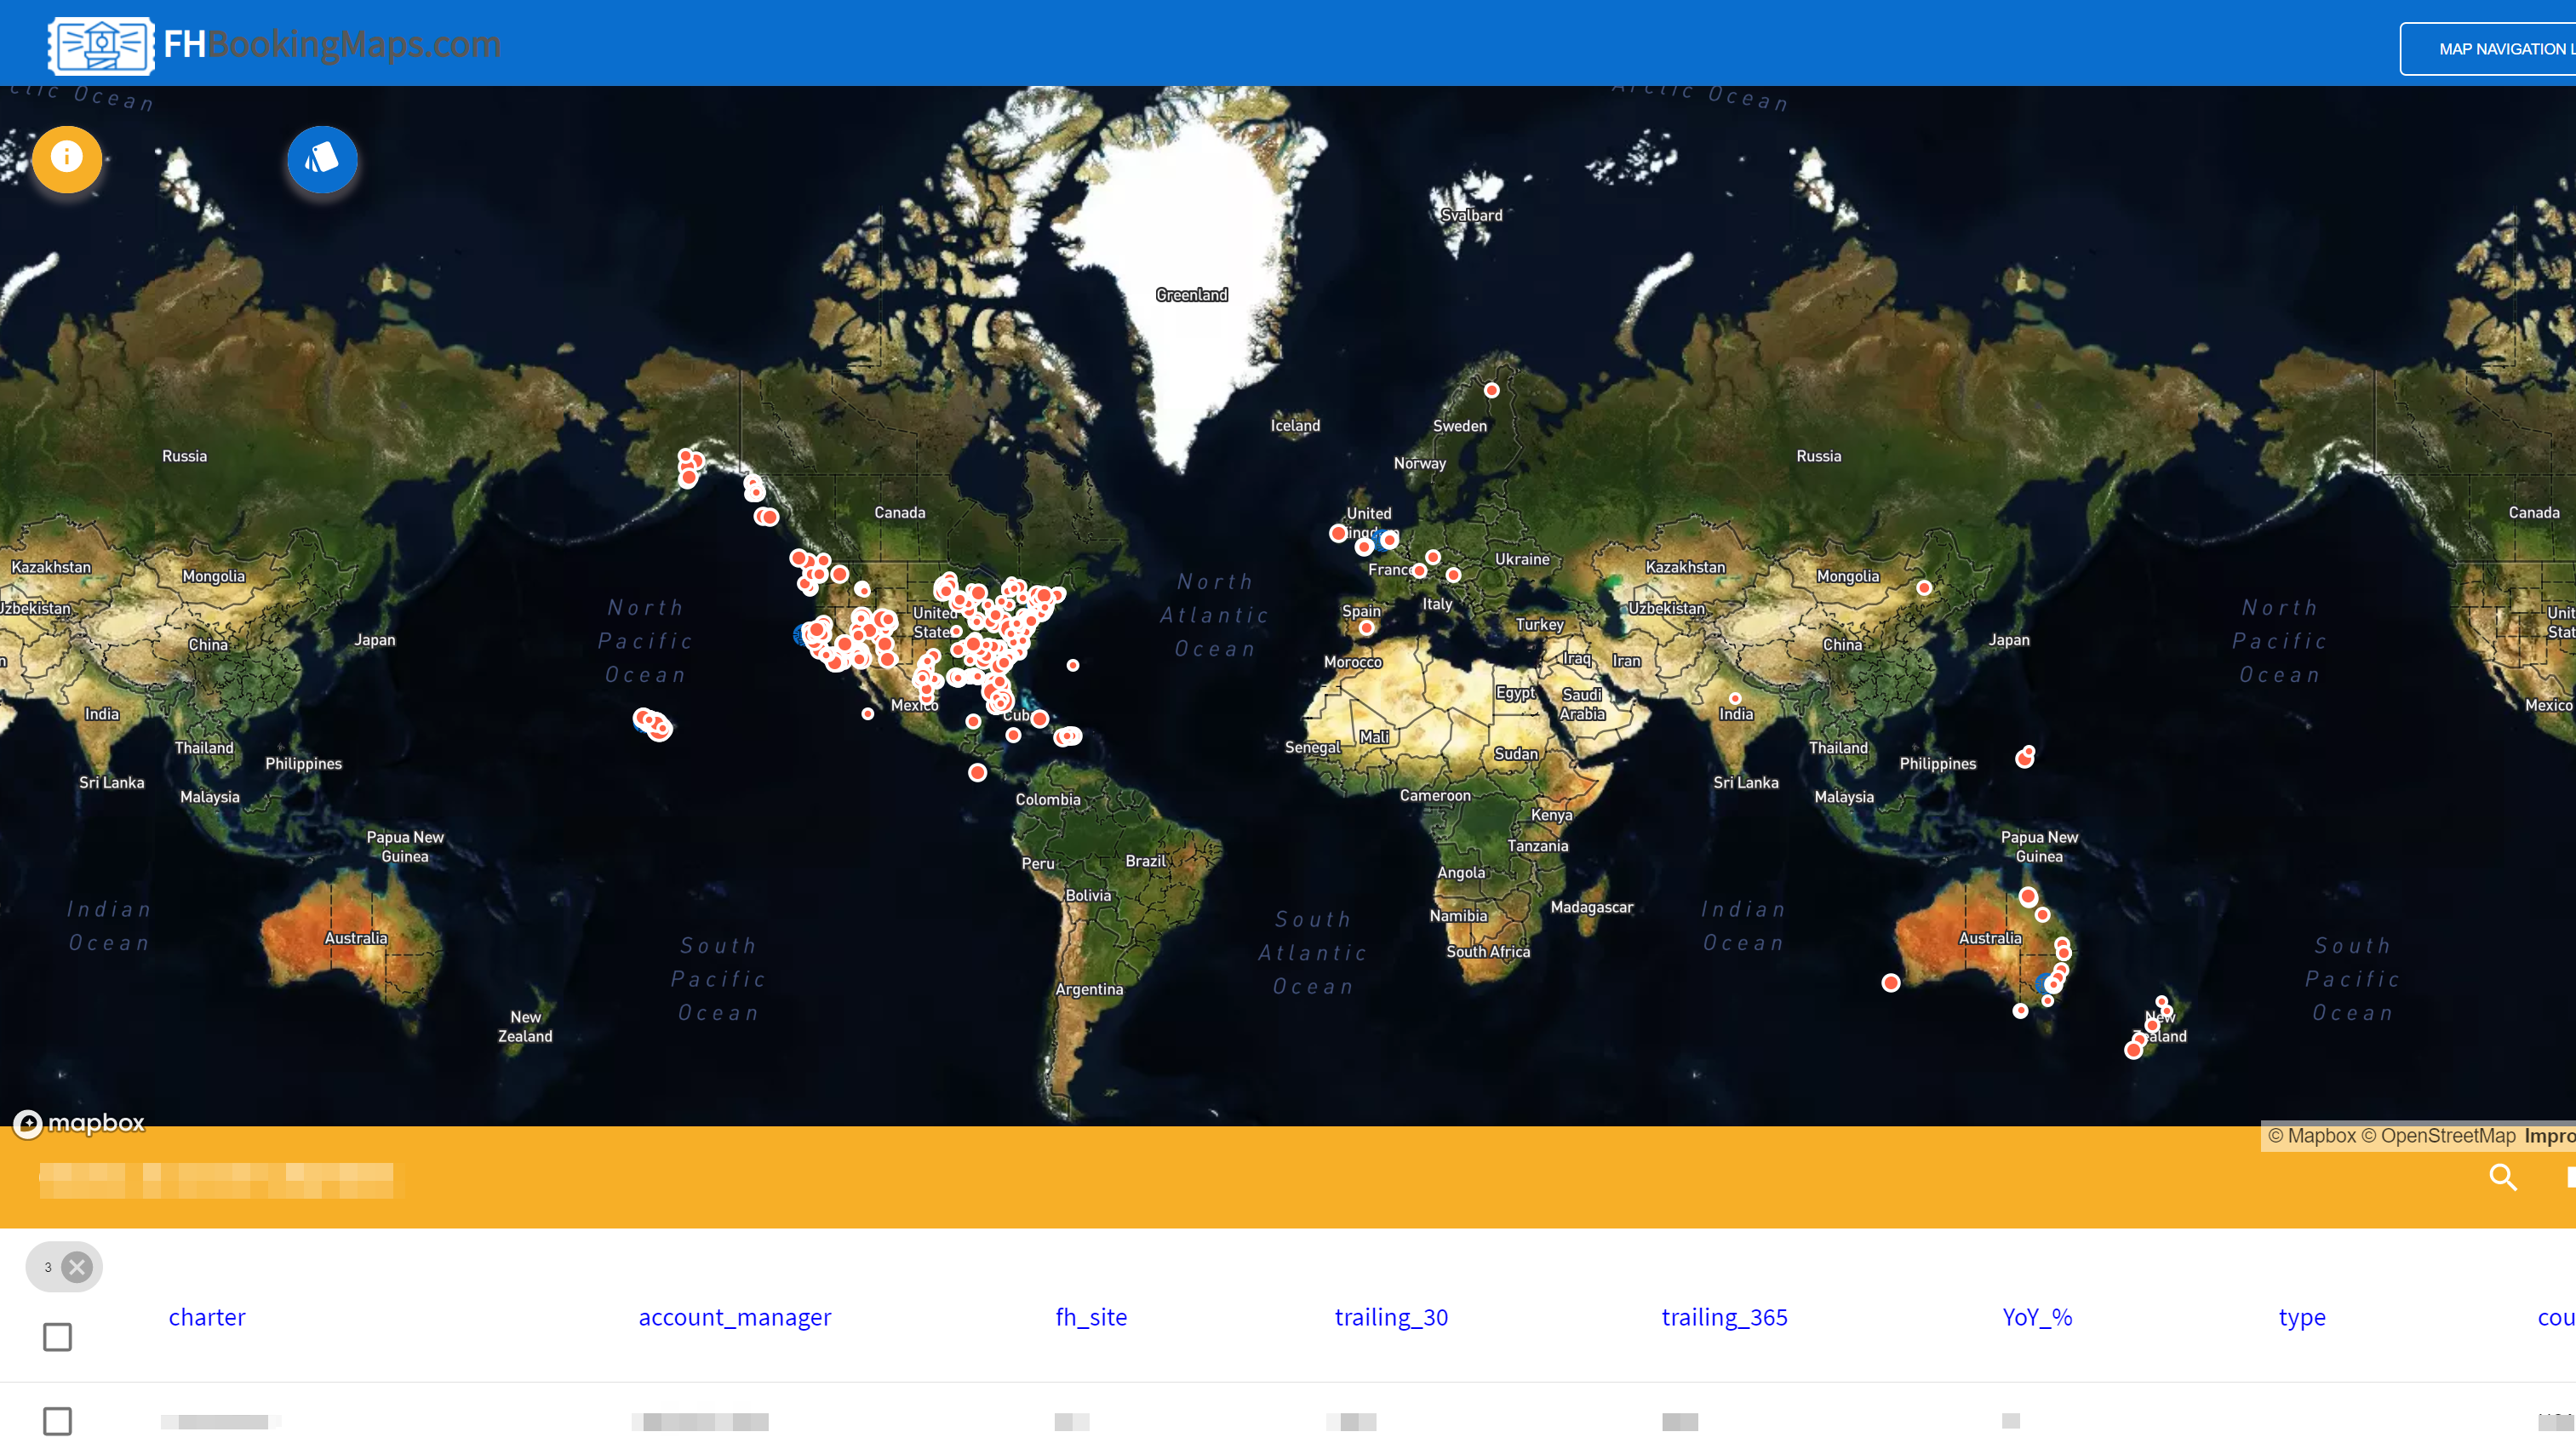
The number one product of our current generation is data. At Union in Design, our goal is to use this data to unite, and build connections to the right audience. How can we get the message out, and present data in a way that is both impactful, and truthful?
Meanwhile, there is so much data to sift through! I am here to help wrangle, process, format, load all of the data and then display it for your users in a way that is visually stunning.
With a lot of complexity in Data and Software Engineering, I also volunteer with those need help spreading their message. Non-profit Youth On Record has been empowering Colorado’s underserved youth to achieve their academic, artistic, and personal goals
for over a decade. To ensure that they can get their data out there and to showcase their community impact, I am working on an interactive map:
Click Here to see the prototype app, soon to be integrated with their website.
Skill Summary
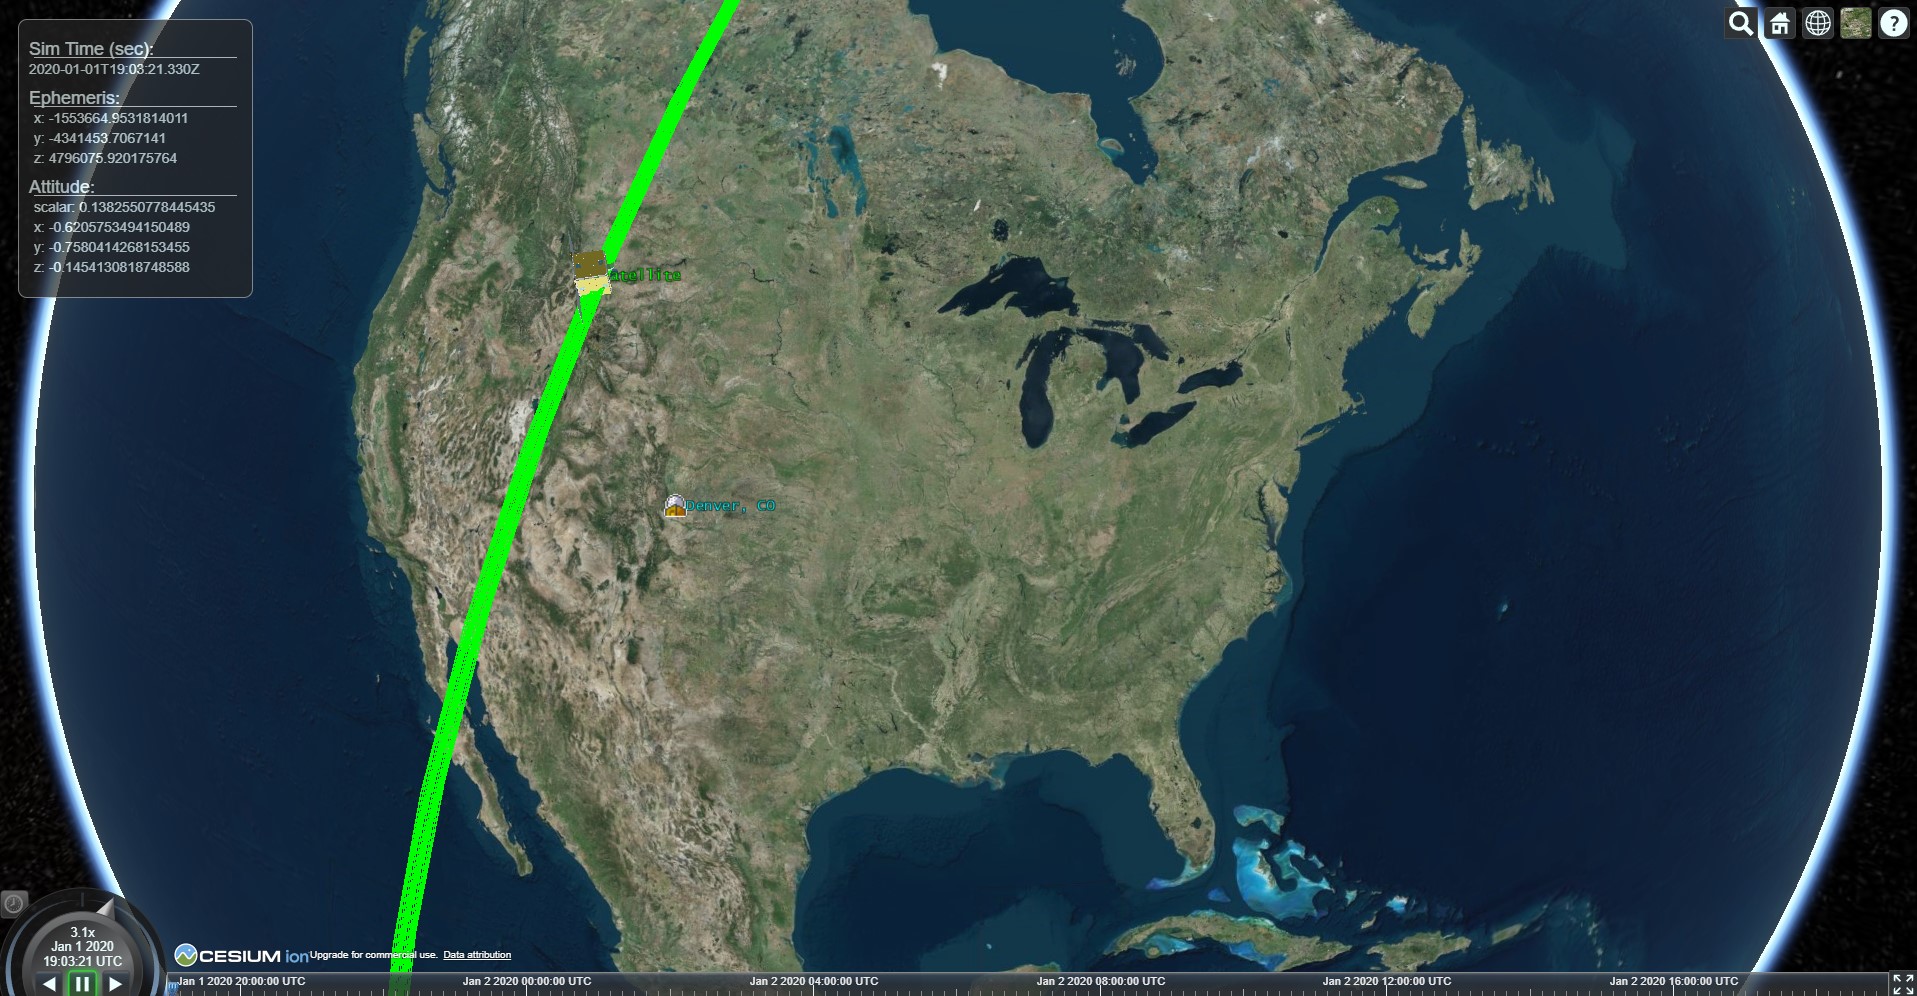
I've come a long way from my humble roots as a yoga teacher, building websites in Dreamweaver and using Photoshop and the Adobe Suite to manipulate images and create logos and such for my private clients. Many screenshots of these old websites remain on this portfolio site, even if the websites have been taken down and replaced with newer and better technologies. I worked on and off as a freelancer for several years, and went as far as I could as a self-taught designer developer before deciding to make a career as a developer. I carry a lot of these experiences with me still in terms of being there for my clients all the way from design to deployment. It wasn't until my previous role as Data Visualization Analyst that the real fun started...here began the transition from rendering static content to building interactive Data Visualizations, and with that querying databases, wrangling data, using Python to combine the results of multiple queries, and onward to even more complex satellite data in the Aerospace industry! So much of a succesful website is dependent on clean data flow, including the right end-points or APIs to get the data to the end user in a meaningful way.
Front End
Exp 10 years
Back End
Exp 4 years
Data Analytics
Exp 3 years
Programming Languages
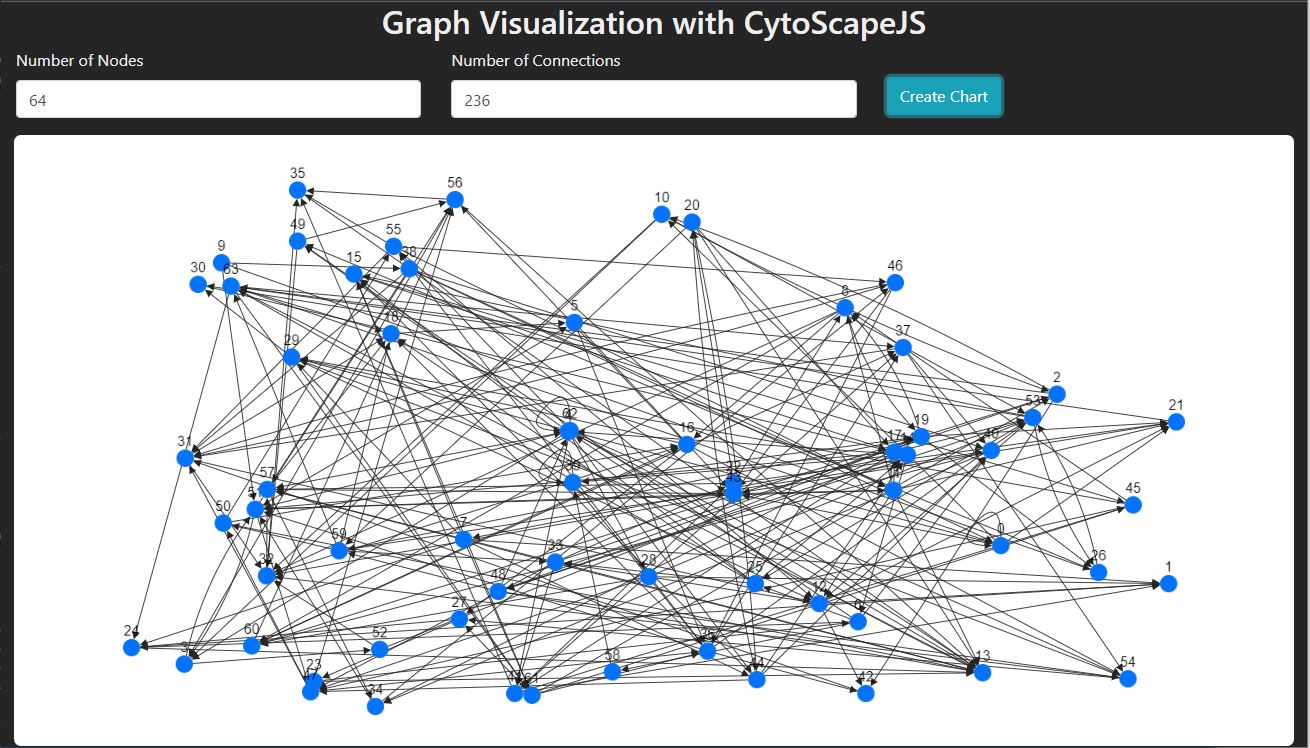
To the right is a short list of just some of the technologies I use on a daily basis. While I work primarily with web apps,
making JavaScript an important tool in my tool belt, I've had significant experience using the Symfony PHP MVC framework, with hundreds of hours spent building and
maintaining API endpoints in and out of the PostgreSQL database. More and more I use Python for back-end and data processing, and have been dabbling with pb-sub architecture
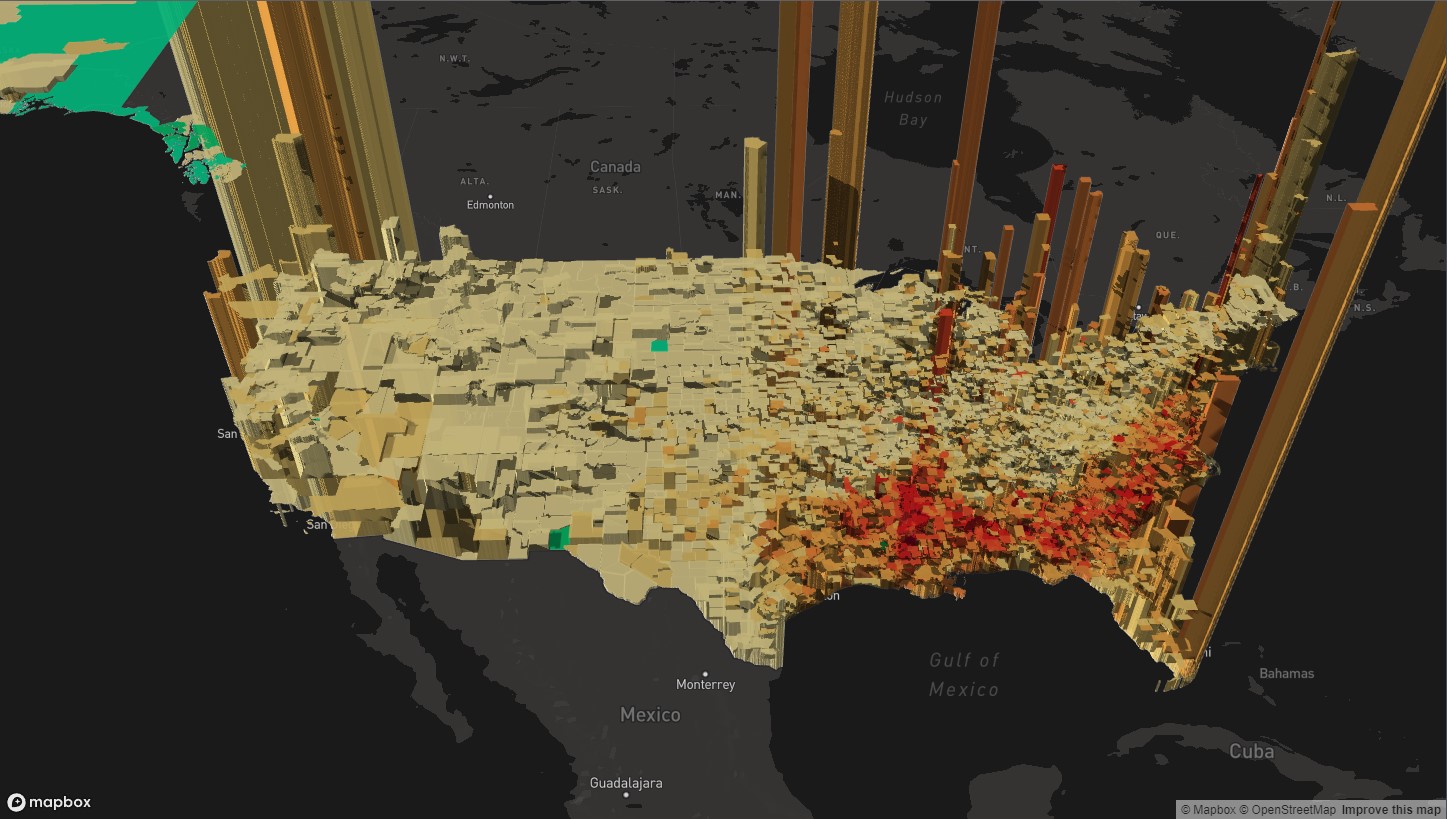
and using message brokers like ActiveMQ and MQTT over websocket for lightning fast, live updates. With Data Visualation as my key area of focus, particulary 3D maps and working with
geospatial data, the sky is the limit (literally!)
Another key area of budding interest is AI and Machine Learning. After getting my feet wet with Sci-kit learn and other Python libraries, and working with Jupyter Notebooks,
there exists endless possibilities for interpretation inerpolation, and extrapolation of data. Depending on the audience, or the organization and the tools they have available, even
programs like Tableau have become important tools to reach for.
Other Related Experience
Work History
I've made many stops along the way to becoming a developer and data analyst. I caught the tail-end of the real estate boom in 2006 and worked as mortgage broker in DC before moving West, and have worked in Academic Recruiting and as a French speaking account Manager for Crocs Footwear in Boulder. When the economy was at a low in 2011 I shifted gears and started working with non-profit organizations, and started teaching youth and adults. I taught languages (French, English), tutored High School students, and eventually becoming a yoga teacher, building websites all the while. Contact me for more info or to download my full resume.
Sales
2005 - 2012Non-profit
2007 - presentMusic & Art
1996 - presentYoga & Fit
2011 - presentFull Stack Portfolio
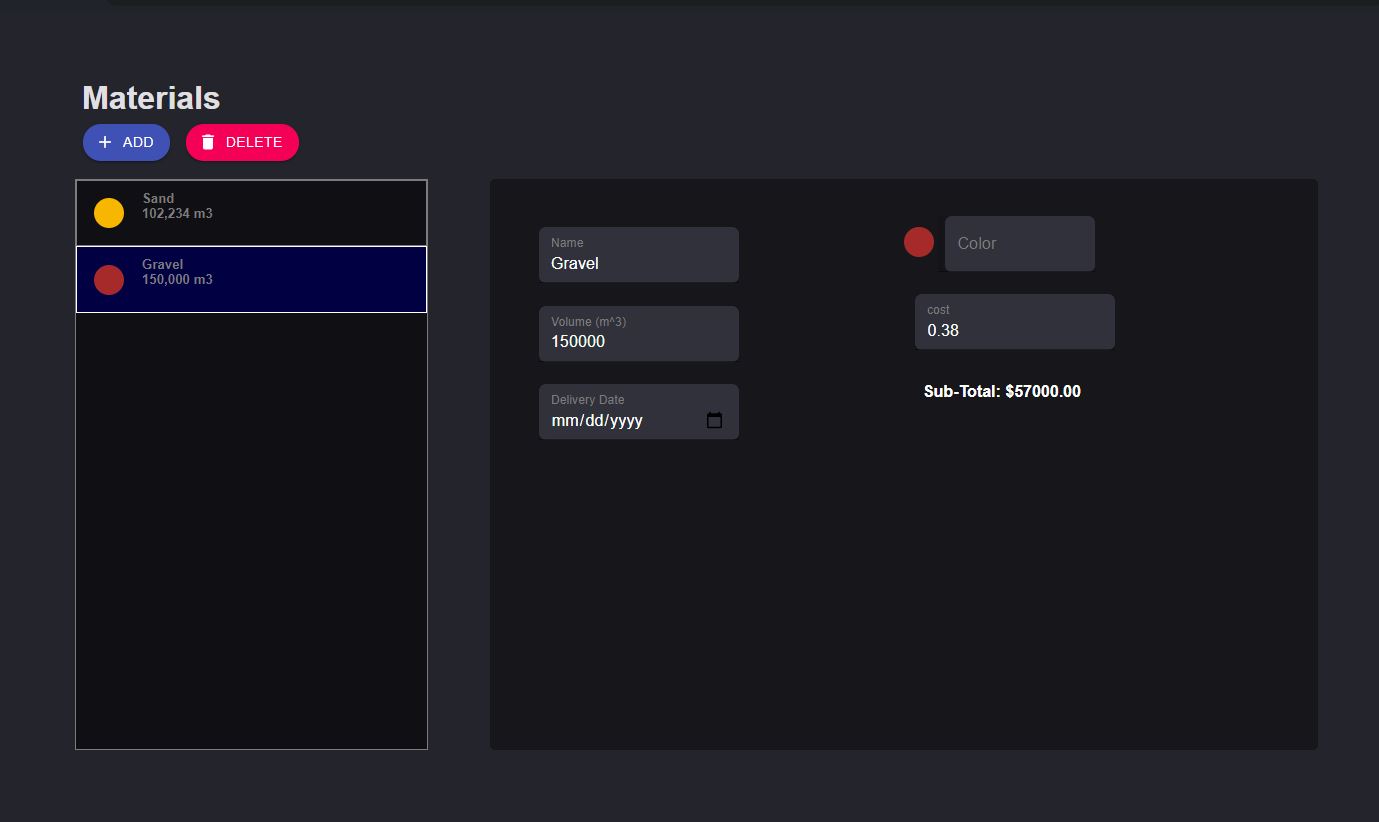
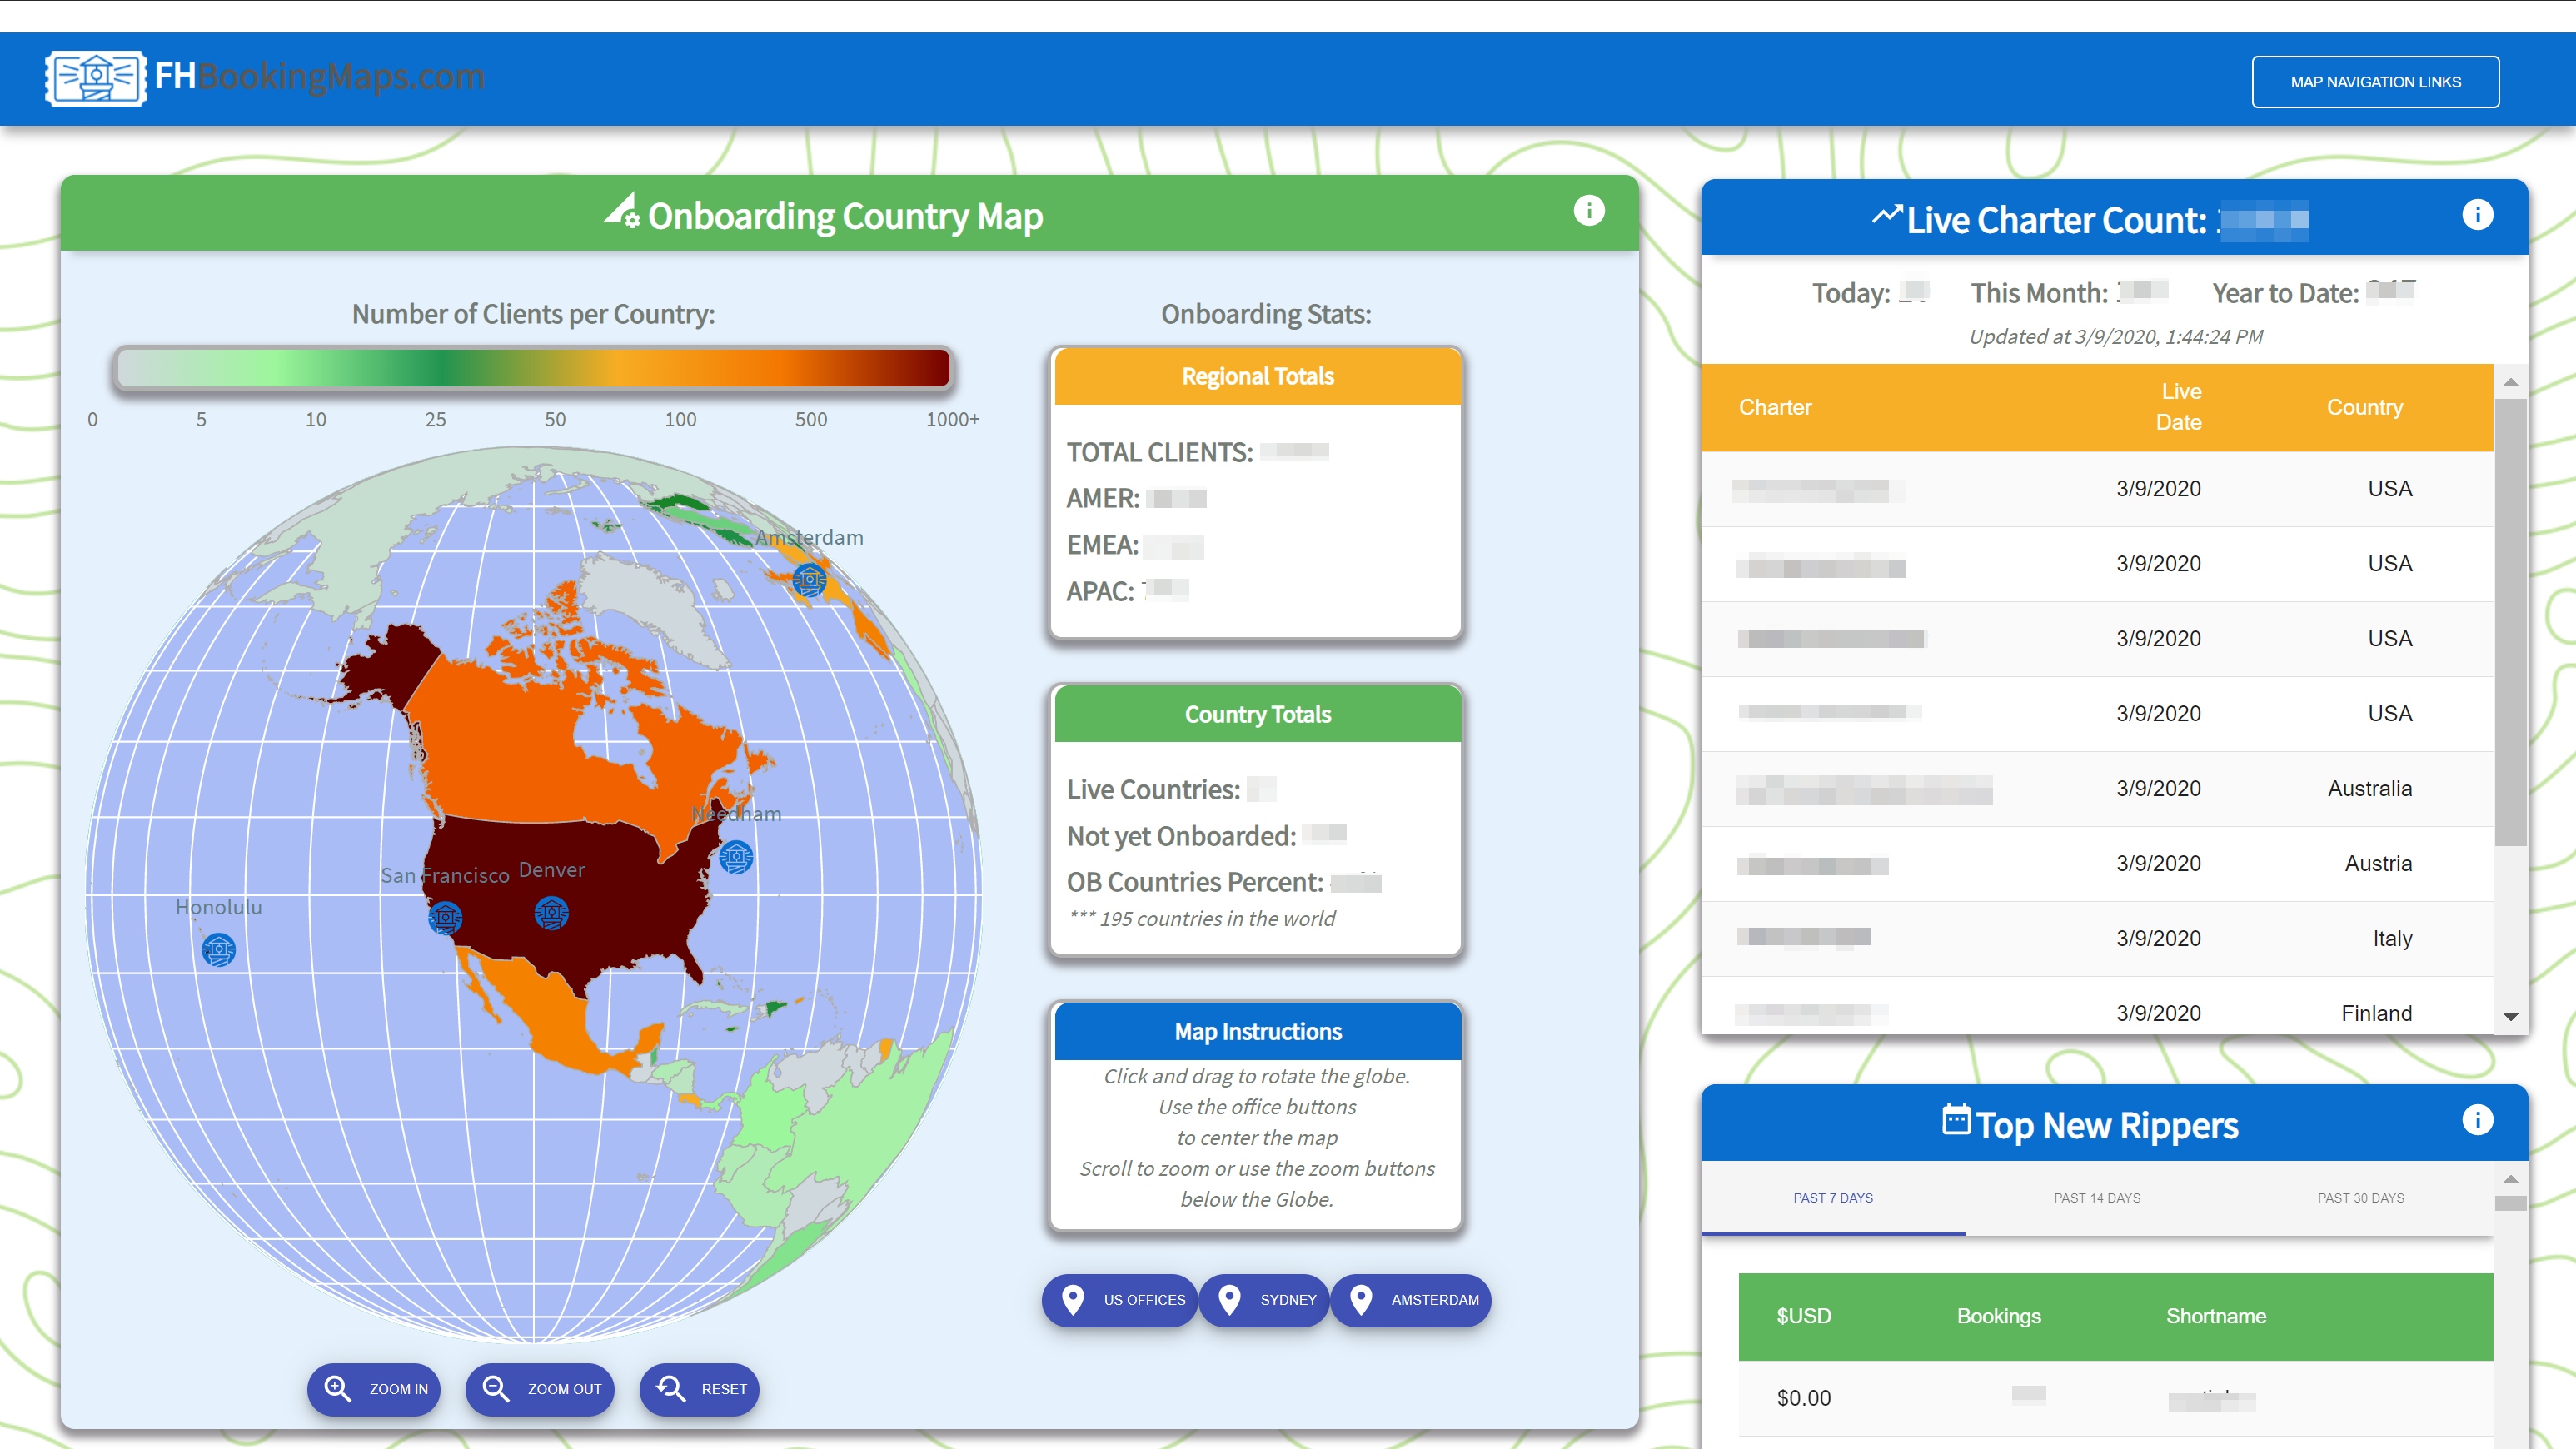
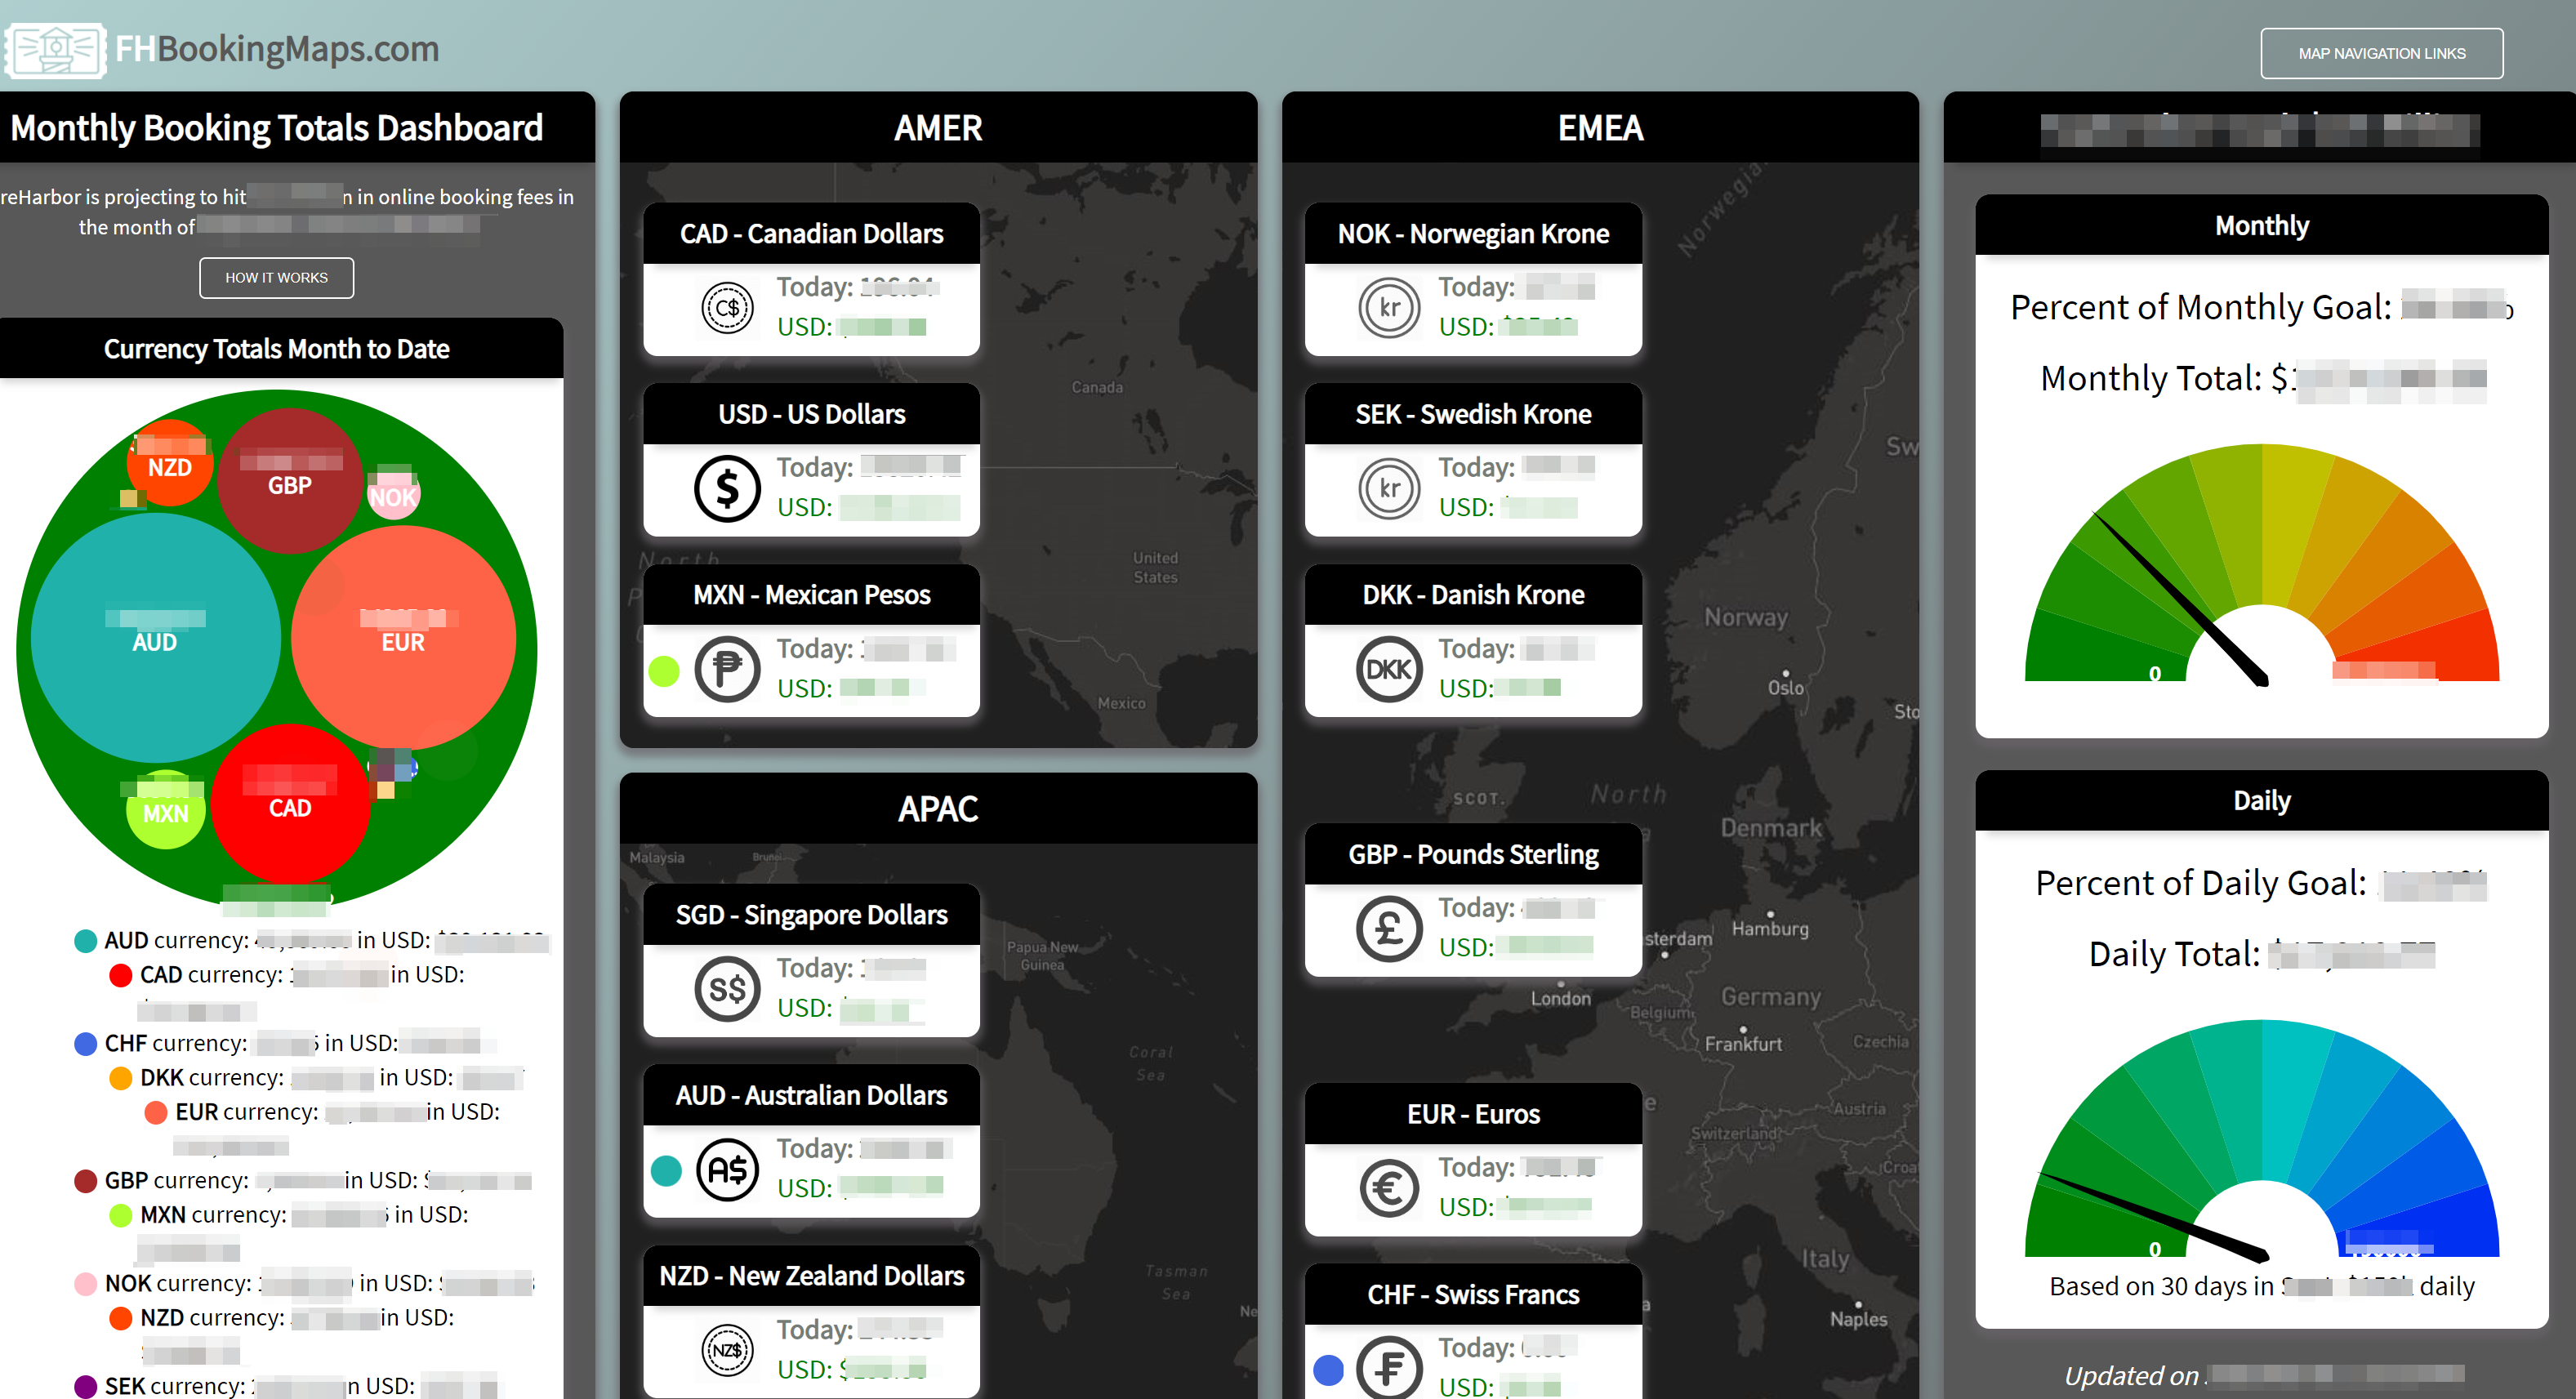
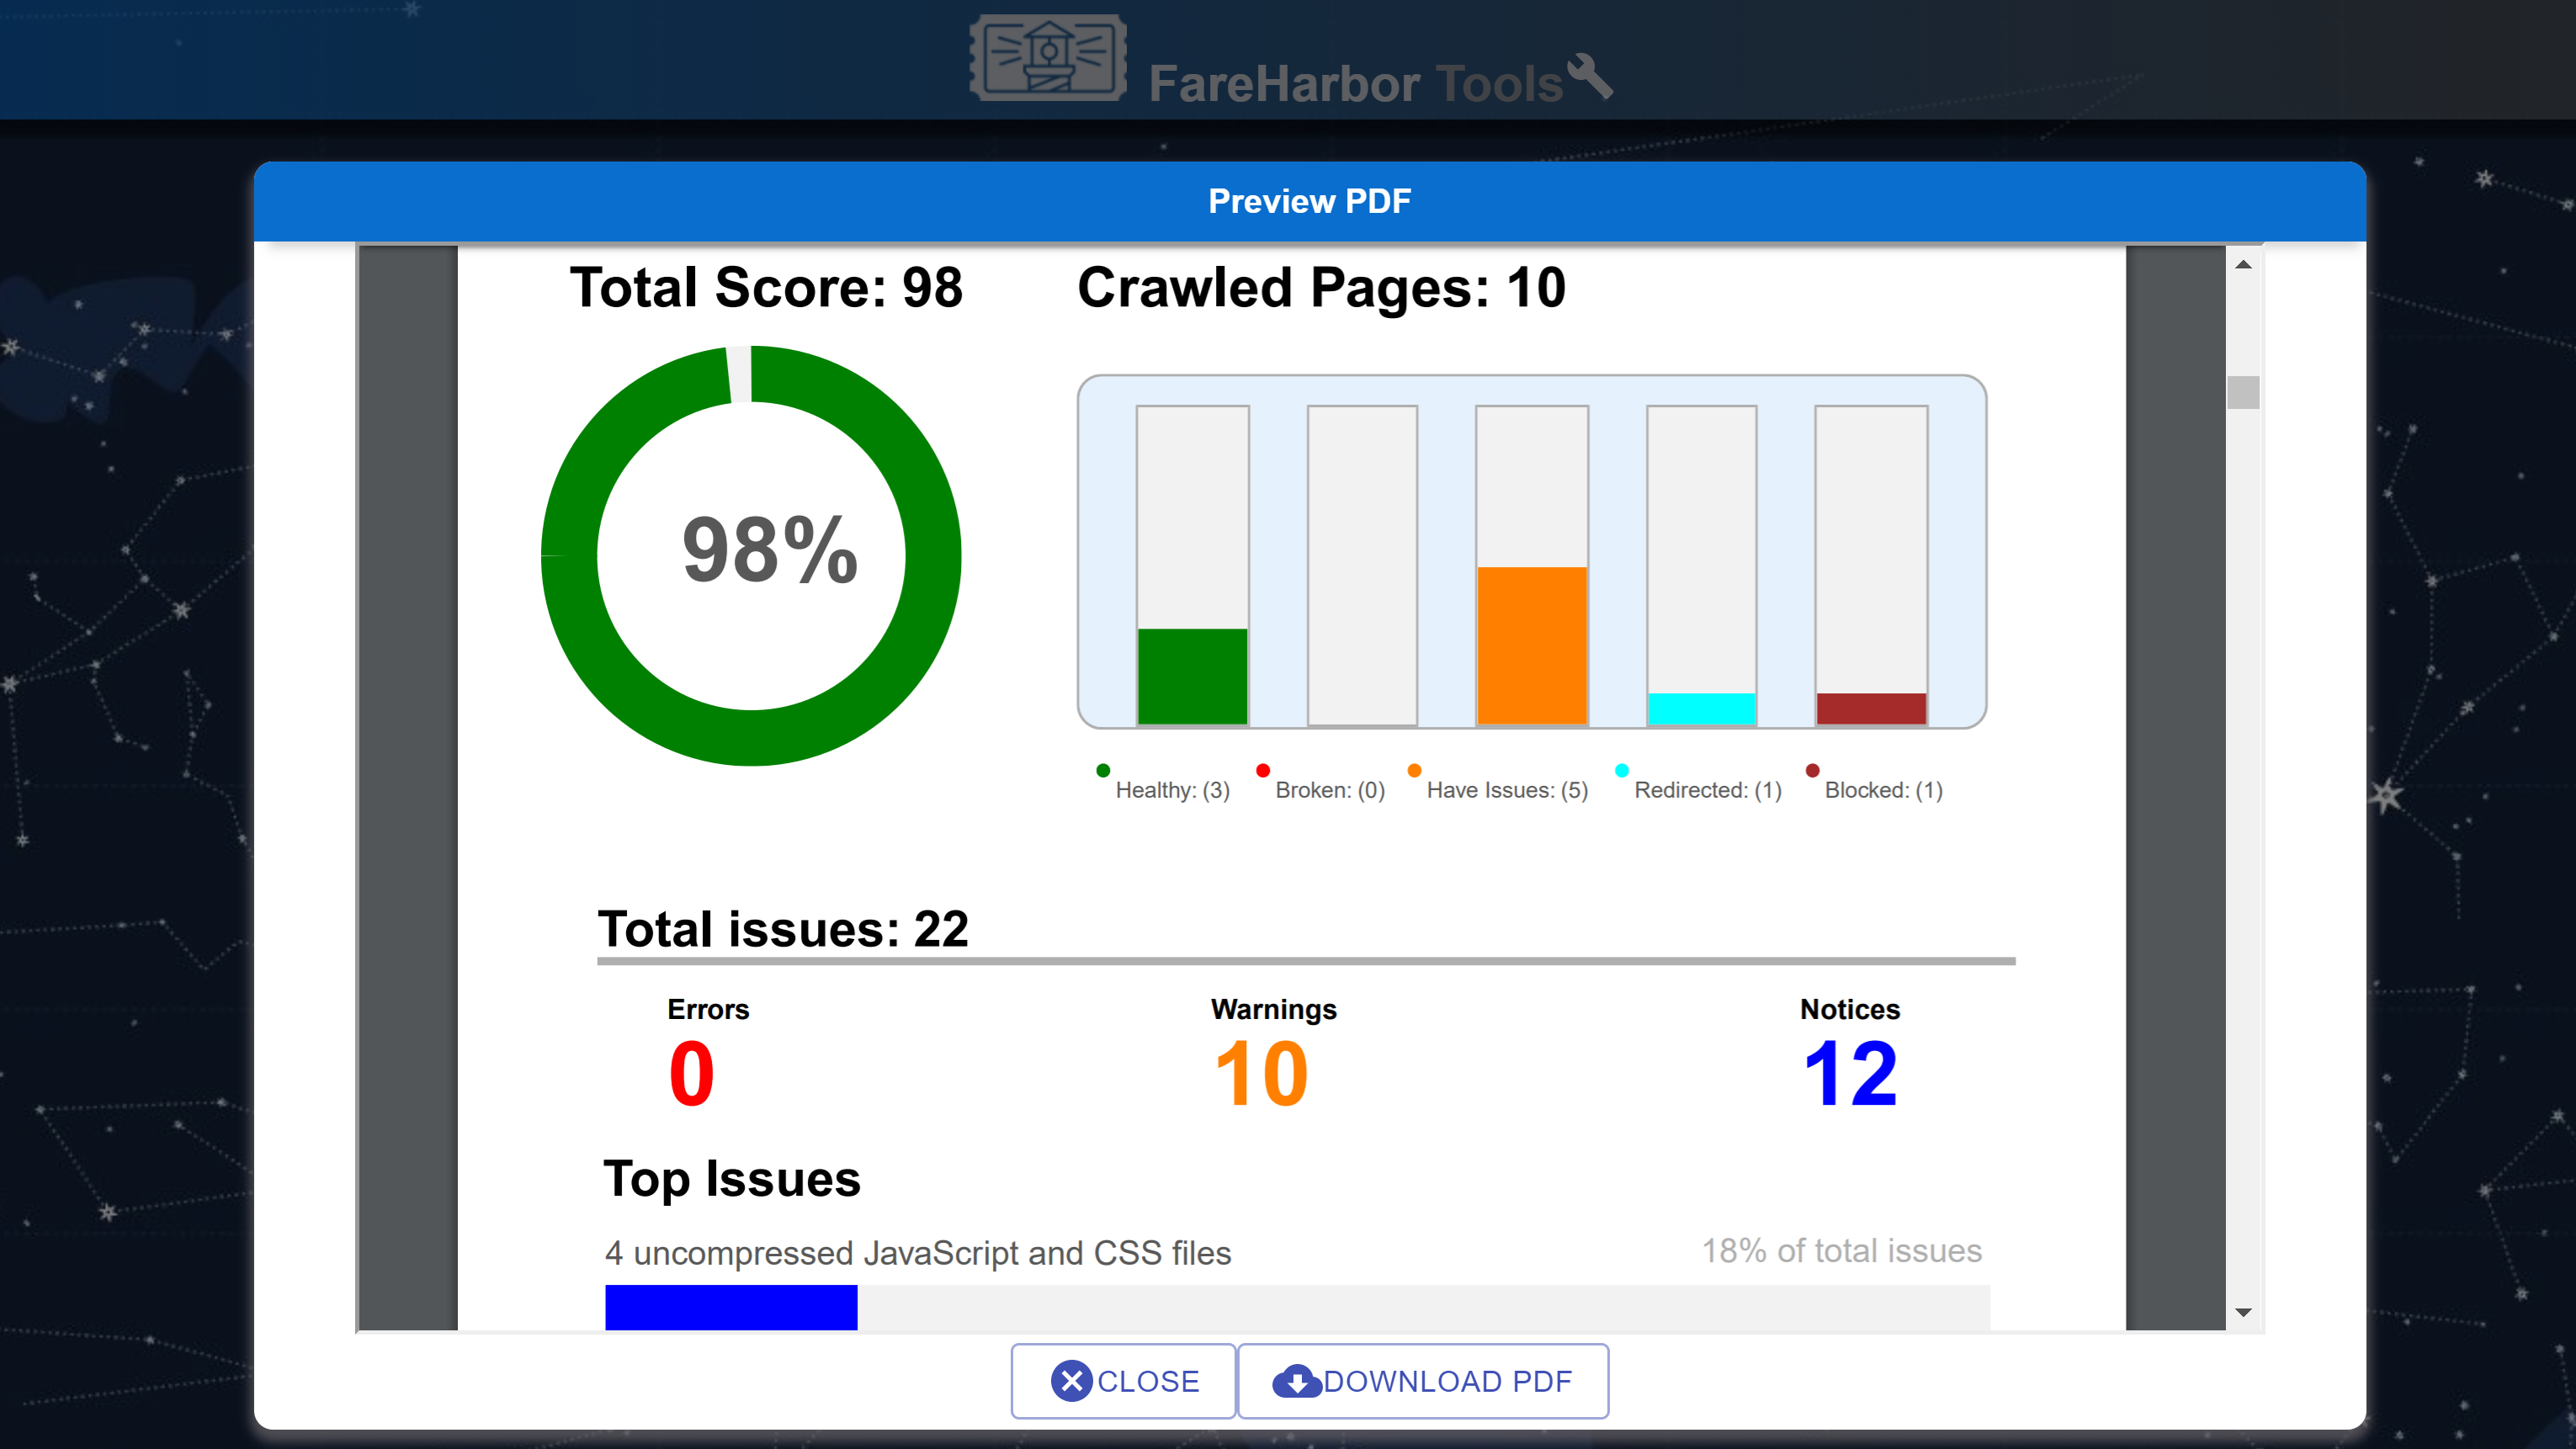
Click the images to see a larger version of each thumbnail image, with links to github repository, deployed application, or stackblitz interactive codepen (where applicable). You can also toggle which ones are visible using the links below. Note that some marked as 'production' are secure production web applications - only screenshots are included, but sensitive data is blurred out. Feel free to contact me for code samples.


Web Design Portfolio
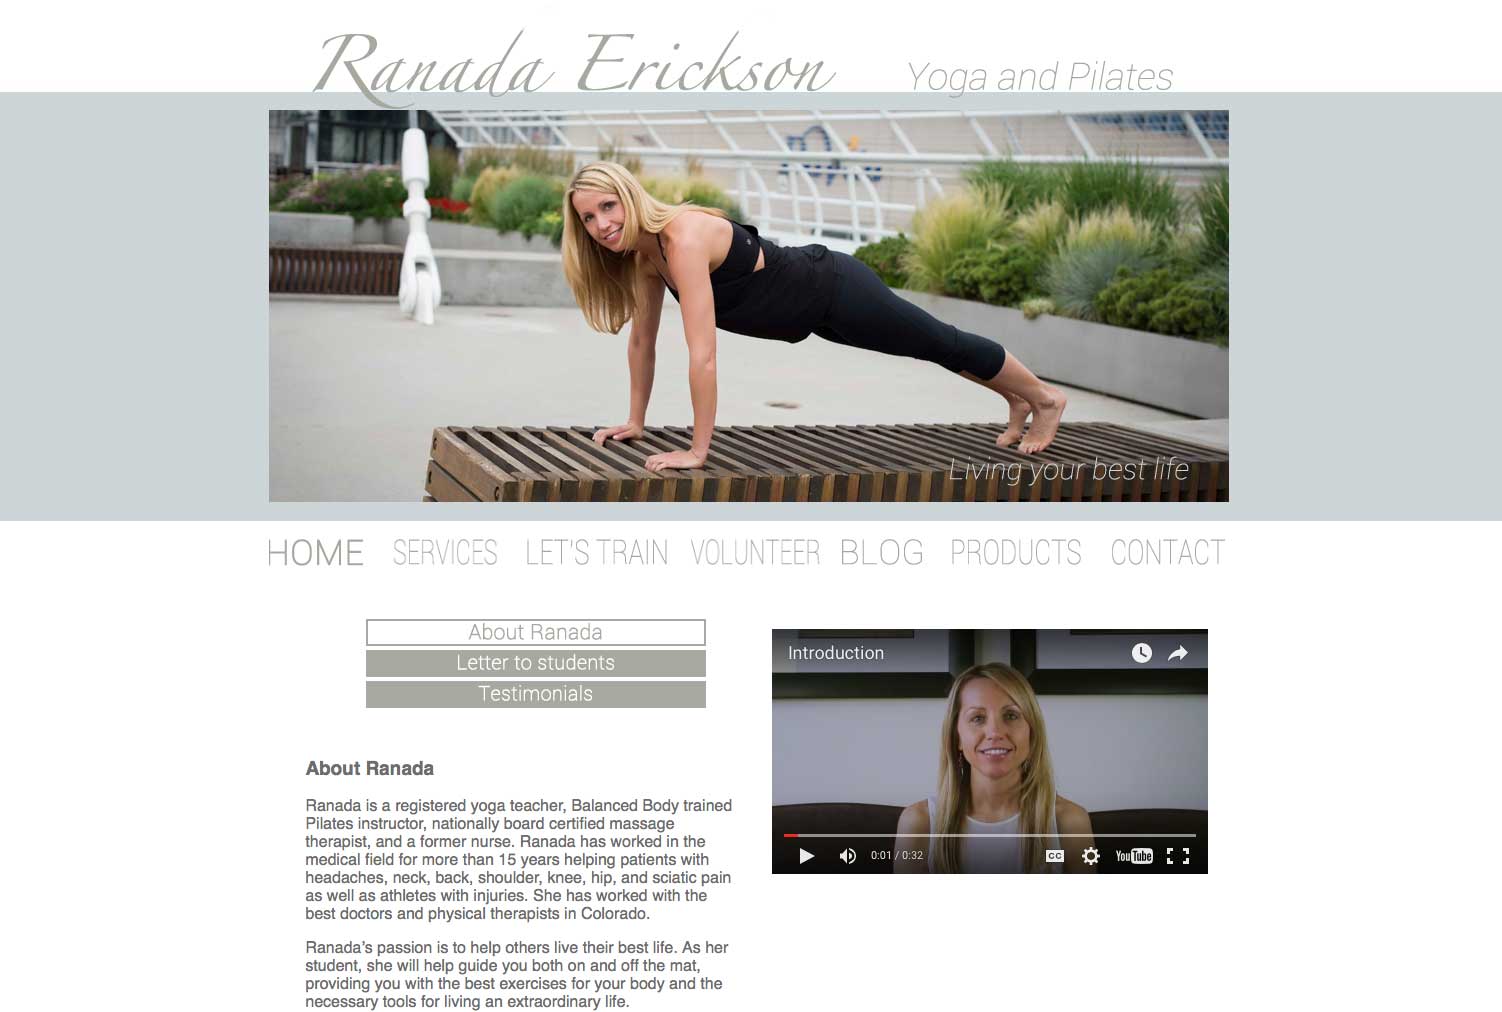
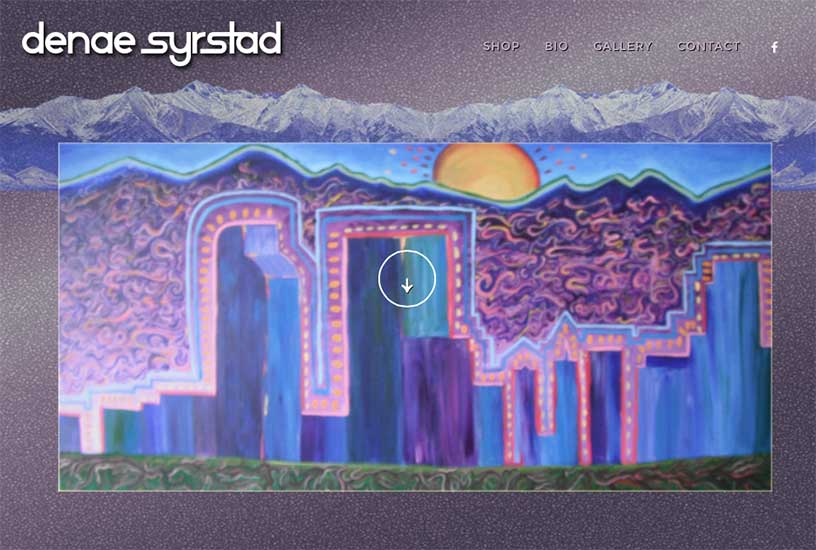
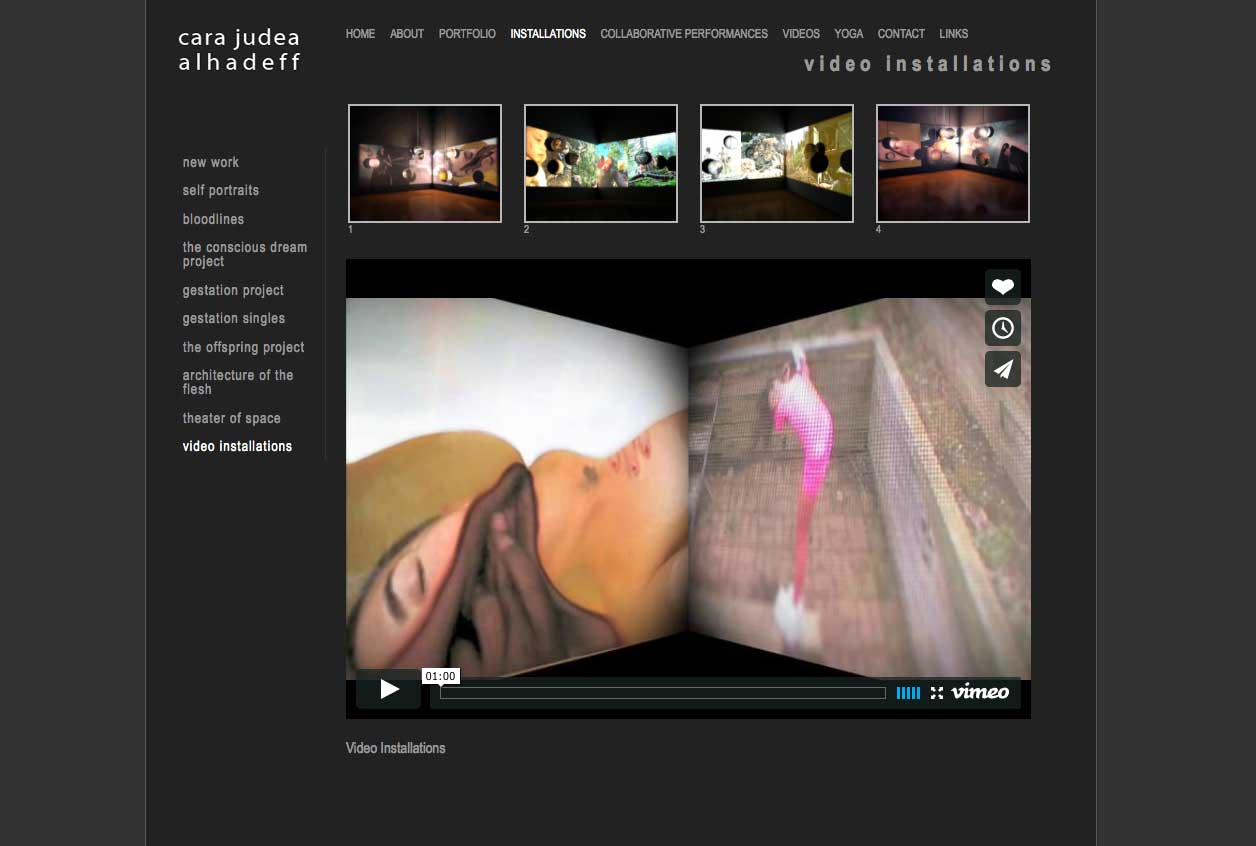
For posterity, you can see images of some of the websites I built as a freelancer from 2011 - 2017(ish). These are images only as these sites are no longer active.


Contact
Please reach out to me connect about data, websites, volunteer help, or other opportunities. You can also use the links in the footer to find me on social media, or visit my github profile.